High School Graduation Rate
Graduating High School In 4 Years
91% of Central Texas students graduate from high school in four years.
Indicator: % of Central Texas students who graduate from high school in four years
Goal: Increase the percentage of Central Texas students who graduate from high school in four years
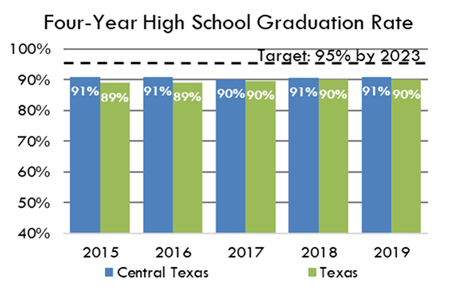
Target: 95% for the Class of 2023
Key trends: Over a five year period, from 2013 to 2017, high school graduation rates in Central Texas have remained relatively unchanged, indicating that we are not on-track to achieving the community goal of a 95% high school graduation rate by 2023. From 2010 to 2019, improvements in the high school graduation rates have occurred for every racial and ethnic group, though achievement gaps remain. The greatest rate of improvement in graduation rates has been seen for Hispanic students. In the Class of 2010, only 76% of Hispanic students graduated. In the Class of 2019 89% of Hispanic students graduated from high school in four years.
what the data tell us
Graduation rates have remained relatively stable over the past five years in Central Texas. Ninety percent of Central Texas students graduated in four years for the Class of 2017, and graduation rates have increased by 13% since the class of 2007.
4 Year Graduation Rate
Definition: Four year completion rate for grades 9-12
Data Source: Texas Education Agency, E3 Alliance
Data Considerations: This data only includes students who graduated from high school in four years. It does not include students who received their GEDs. This data is not directly comparable to graduation rate data produced for prior graduation classes due to changes in data definitions by the Texas Education Agency. The Central Texas data includes 35 school districts and was aggregated by E3 Alliance.
the story behind the indicator
Graduation rates have remained relatively unchanged over the past 5 years in Central Texas and across the state of Texas. Ninety-one percent of Central Texas students and 90% of students in Texas graduated in four years for the Class of 2019. In 4 out of the past 5 years, the Central Texas graduation rate exceeded Texas’ graduation rate, and graduation rates have increased 24% since the class of 2007.
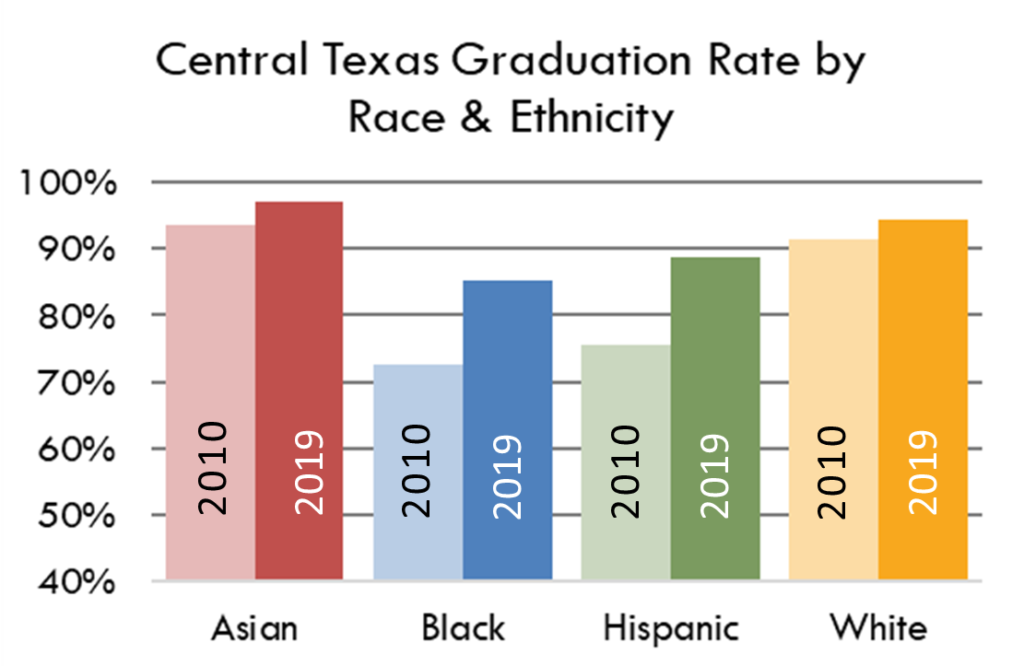
Disparities in graduation rates by race and ethnicity also exist. For the Class of 2019, 97% of Asian and 95% of White students in Central Texas graduated in four years, compared to 85% of African-American and 89% of Hispanic students. The gap between African-American and White students was 9% for the class of 2019, narrowed from 19% in the class of 2010. The gap between Hispanic and White students was 6% for the class of 2019, compared to 16% in the class of 2010. Even greater disparities emerge when this data is analyzed by gender. Click here for an E3 report prepared for the Greater Austin Area My Brother’s Keeper Initiative on this topic.
some local efforts to improve this indicator
-
Collaborative Initiatives
- Austin Community College works with area school districts to create stronger connections between high school and college. ACC Tech, Early College Start, and Early College High School ease the transition to post-secondary education by providing opportunities for high school students to complete college credit while in school.
- The Manor ISD/ACC Career Certification Center opened in November of 2015. This first of its kind center, provided in partnership with Austin Community College, offers high school juniors and seniors opportunities to earn industry certifications in Certified Nursing Assistant, Medical Assistant, PC Technician, HVAC, Electrical Pre-Apprenticeship and Mechatronics.
- Manor ISD’S New Technology High School offers project-based learning focused in the areas of Science, Technology, Engineering and Mathematics. Students are accepted through a blind lottery and are representative of the demographics of the district at-large.
- Pathways of Promise is a partnership between the E3 Alliance and UT’s Center for STEM Education that provides professional development to middle school math teachers with the goal of increasing the number of students who pursue advanced mathematics. Currently on 6 campuses, the goal is to expand to 12 campuses in 5 school districts in 2016.
- The E3 Alliance, Austin Area Research Organization, Central Texas Education Funders, Incite Marketing, Emmis Communications, and various school districts across the region have launched a “Missing School Matters” attendance campaign. The goal is to increase attendance by an average of three school days per student. The State of Texas funds schools based their Average Daily Attendance, so this increase in attendance would increase state funding to schools by $34 million.
- The E3 Alliance’s Blueprint for Educational Change reports that on-time graduation has a positive effect on future employment and earnings. According to their research, a majority of jobs will require a credential beyond a high school degree by 2020. E3 works with public and private organizations to align strategies that promote on-time graduation and connections to higher education.
a closer look at the story behind the indicator
Click any of the section titles below to view related graph and information.
4-Year High School Graduation Rate, by Race & Ethnicity, Central Texas
Although disparities exist by race and ethnicity, the gap has closed over the last ten years, particularly since 2007, according to the E3 Alliance. For the Class of 2019, 97% of Asian and 95% of White students in Central Texas graduated in four years, compared to 89% Hispanic students and 85% of African-American students. The gap between African-American and White students was 9% for the class of 2019, compared to 7% in the class of 2015. The gap between Hispanic and White students was 6% for the class of 2019, compared to 6% in the class of 2015.
Definition: Four year completion rate for grades 9-12
Data Source: Texas Education Agency, E3 Alliance
Data Considerations: This data only includes students who graduated from high school in four years. It does not include students who received their GEDs. This data is not directly comparable to graduation rate data produced for prior graduation classes due to changes in data definitions by the Texas Education Agency. The Central Texas data includes 35 school districts and was aggregated by E3 Alliance.
Central Texas Graduation Rate by Income Status
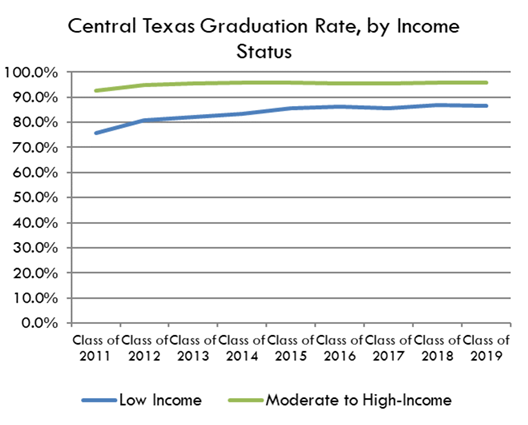
Gaps in graduation rates by income have narrowed in recent years, although disparities persist. The E3 Alliance reports that the graduation rate for low-income students in the Class of 2019 was 86%, compared to a 96% graduation rate for non-low-income students, a gap of 10 percentage points. This gap has narrowed since the Class of 2007, when only 60% of low-income students graduated, compared to 88% of non-low-income students, a gap of 28 percentage points. Although disparities in graduation rates by race and ethnicity exist in our community, these gaps have narrowed over time as well.
Definition: The graduation rate for students considered economically disadvantaged and those not identified as economically disadvantaged in the Austin Independent School District.
Data Source: Texas Education Agency, E3 Alliance
Data Considerations: This data only includes students who graduated from high school in four years. It does not include students who received their GEDs. This data is not directly comparable to graduation rate data produced for prior graduation classes due to changes in data definitions by the Texas Education Agency. Students are defined as economically disadvantaged if they are eligible for free or reduced-price lunches or other public assistance. The Central Texas data includes 35 school districts and was aggregated by E3 Alliance.
Graduation Rates for Area School Districts
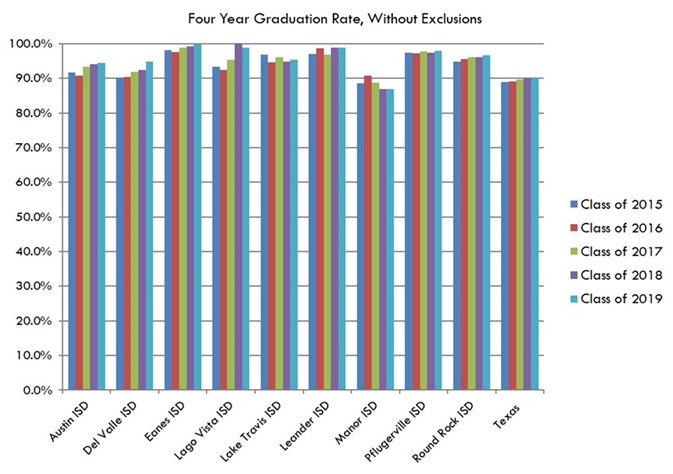
Graduation rates for area districts have improved over time. Most school districts listed below have seen an improvement in graduation rates from 2015 to 2019, except for the Lake Travis, and Manor School Districts, which saw a slight decrease in their graduation rates. Eanes ISD had the highest graduation rate, with 99.8% of students in the Class of 2019 graduating. Lago Vista ISD had the greatest improvement in its graduation rate; going from 93.3% in 2015 to 98.9% in 2019.
Definition: 4-year graduation rate, without exclusions
Data Source: Texas Education Agency
Data Considerations: This data only includes students who graduated from high school in four years. It does not include students who received their GEDs.
Percent of High School Graduates that are College Ready
College readiness rates in area school districts have trended upward over time, though they vary by district. The greatest improvements in college readiness occurred in Del Valle ISD and Lago Vista ISD which both experienced a 67% improvement in college readiness rates. In 2008, only 24% of Del Valle students graduated from high school “college ready,” and in 2014 the rate increased to 40%. Lago Vista ISD’s college readiness rate went from 49% in 2008 to 82% in 2014. Only one school district experienced a decline in college readiness. Pflugerville ISD’s college readiness rate went from 51% in 2008 to 48% in 2014.

Definition: Percent of high school graduates who scored at or above the criterion score on both the TAKS, SAT, or ACT English language arts and mathematics tests.
Data Source: Texas Education Agency
Data Considerations: To learn more about college readiness criterion visit the TEA’s website, here This data does not include the college readiness rates of high school seniors who dropped out, continued high school, or received a GED.
Graduation Rate, by High School, Austin MSA, Class of 2014
The map below shows the four-year graduation rates for the Class of 2014 for high schools in districts located in the 5-county Austin-Round Rock Metro Area. The map demonstrates a geographic disparity in graduation rates between schools located in different areas of the region. The majority of school districts in the Austin region, though, graduate 90% or more of their students.

Definition: Four year completion rate for grades 9-12
Data Source: Texas Education Agency. Map was created by the Community Advancement Network.
Data Considerations: This data only includes students who graduated from high school in four years. It does not include students who received their GEDs. This data is not directly comparable to graduation rate data produced for prior graduation classes due to changes in data definitions by the Texas Education Agency. Cedar Ridge High School is not included on the map, as 4-year graduation rates were not both available for this school for the Class of 2014.
College-Ready Rate, by High School, Austin MSA, Class of 2014
The map below shows college readiness rates for the Class of 2014 for high schools in districts located in the 5-county Austin-Round Rock Metro Area. Generally, college readiness rates are higher at high schools located towards the western portion of the metro area, and lower at high schools located towards the east.

Definition: Percent of high school graduates who scored at or above the criterion score on both the TAKS, SAT, or ACT English language arts and mathematics tests by high school. To learn more about college readiness criterion visit the TEA’s website, here.
Data Source: Texas Education Agency. Map was created by the Community Advancement Network.
Data Considerations: This data does not include the college readiness rates of high school seniors who dropped out, continued high school, or received a GED. This data does not include the college readiness rates of high school seniors who dropped out, continued high school, or received a GED. Cedar Ridge High School is not included on this map, as 4-year graduation rates were not both available for this school for the Class of 2014.
disproportionately impacted
The American Psychological Association states there are numerous risk factors, which in combination with each other, raise the probability of a student dropping out of high school:
- Individual Risk Factors (e.g. truancy, poor school attitude, etc.)
- Family Risk Factors (e.g. low-income, lack of parental involvement, etc.)
- School Risk Factors (e.g. negative school climate, low expectations, etc.)
- Community Risk Factors (e.g. high crime, lack of community support for schools, etc.)
According to the E3 Alliance, students who were retained in 9th grade, students who were frequently absent, and students who moved or changed schools frequently were less likely to graduate in four years than other students.
2018 © Ready by 21 Austin
Ready by 21 (RB21) and the RB21 logo are registered trademarks of the Forum for Youth Investment. The Central Texas RB21 Coalition is a member of the Forum’s RB21 Learning Network. The Central Texas RB21 online dashboard is currently sponsored by Workforce Solutions — Capital Area Workforce Board, the Community Advancement Network (CAN) and the City of Austin, with content and data contributions from over 20 local youth-serving coalitions.