With Disciplinary Actions Resulting in Classroom Removals
Indicator: Disciplinary Action Resulting In Classroom Removal
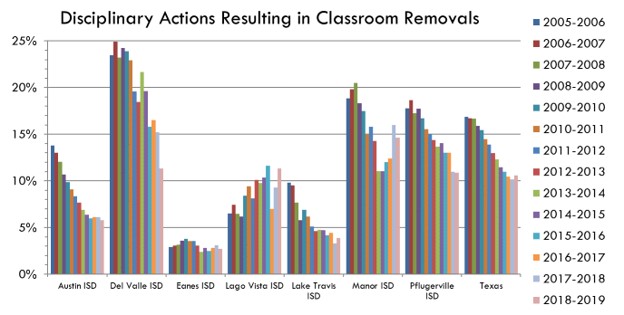
Progress: Many area school districts have made progress in reducing the percentage of students removed from the classroom for disciplinary reasons, mirroring a statewide trend. Nevertheless, disparities remain across the area, with districts in eastern Travis County removing students at a high rate than schools in the central and western portions of the county. Beginning in March, 2020, the COVID-19 pandemic forced many schools to switch to distance and/or hybrid education models as a result of the COVID-19 pandemic.
Significance of Indicator: According to the Breaking Schools’ Rules report released by The Justice Center at the Council of State Governments, being suspended or expelled significantly increased the likelihood that the student was involved with the juvenile justice system the following year.
what the data tell us
The percentage of students subject to disciplinary action in a given school year decreased in most area school districts between the 2005-2006 and 2018-2019 school years, in line with statewide trends. Overall, districts in the state of Texas have reduced the percentage of students subject to disciplinary removals from the classroom from 16.9% of students in the 2005-2006 school year to 10.6% of students in the 2018-2019 school year. Nevertheless, rates of school discipline vary by district locally, with districts in eastern Travis County disciplining students at a higher rate than districts in the central and western portions of the county. Due to the impact of the COVID-19 pandemic on in-person school attendance, the 2019-2020 and 2021-2022 school year disciplinary removal data may not be meaningfully compared with previous years’ data.
Definition: The percentage of students with at least one disciplinary action that resulted in removal from the classroom. Discipline actions include In-School Suspension, Out-of-School Suspension, placement in a Disciplinary Alternative Education Program, Placement in a Juvenile Justice Alternative Education Program, and Expulsion
Data Source: Texas Education Agency, Discipline Data
Data Considerations: The numerator represents the districts total discipline population in a given school year. This represents the number of students subject to disciplinary action, rather than the number of actions. A students may be subject to more than one disciplinary action in a given school year. Total students (and total by race) represents Cumulative Year-End Enrollment and may differ from other estimates of the total student populations, including among other Texas Education Agency reports, such as the Texas Academic Performance Reports (TAPR measures enrollment on a given day in October of each year)
some local efforts to improve this indicator
- Austin ISD’s Child Study System provides an integrated electronic system utilized by Learning Support Services to provide a continuum of support for students to help meet their behavior, academic, attendance, and speech/language needs. The district also has begun using Learning Support Centers, to keep students removed from the classroom for certain offenses on their home campus, rather than being sent to an Alternative Learning Center. The district also began implementing a social and emotional learning curriculum at a number of campuses during the 2011-2012 school year, with at all of its campuses scheduled to adopt the curriculum by the 2015-2016 school year. The curriculum includes development of competencies including self-awareness, self-management, social awareness, relationship skills, and responsible decision-making. Analysis of the program’s impact is ongoing, though according to a preliminary evaluation, discretionary removals improved for each school cohort entering the program, but greatest for schools that had participated in the program for three or four years. Among schools utilizing the SEL curriculum for four years, the overrepresentation of African-American students with discretionary removals decreased slightly, although overrepresentation for Hispanic students increased.
- A number of organizations provide programs designed to promote positive behavior and development. The X-Y Zone, a partnership between Austin ISD and Communities in Schools, works to increase academic outcomes and decrease disciplinary involvement, by supporting and guiding adolescent males through a leadership development program. CARY, the Council on At-Risk Youth, implements youth violence prevention programs, particularly among middle school students. SafePlace’s Expect Respect program engages youth, parents, schools, and communities in building health teen relationships, and preventing dating abuse. The Anti-Defamation League’s No Place for Hate initiative works to makes schools places of “respect, unity, and character.” A number of mentoring programs provide positive role models for youth at-risk of disciplinary involvement. The Youth Services Mapping site allows parents, teachers, and community members to find services available on their campus.
- Possession of a controlled substance is a common cause for disciplinary action. For more information on youth substance use, see the
The story behind the indicator
Several reports in recent years have highlighted school discipline, its disproportionate impact on certain groups of students, and the tie between school discipline and later involvement with the criminal justice system, as major issues. A 2007 study by Texas Appleseed found that African-American and special education students were disproportionately represented in the school disciplinary population. An earlier study by the Texas A & M Public Policy Research Institute found that youth, particularly males, who have a history of school disciplinary involvement are most at-risk for involvement with the juvenile justice system.
The 2011 Breaking Schools’ Rules report from The Justice Center at the Council of State Governments examined the records of 1 million Texas students over six years. The report found that almost 6 of 10 students were suspended or expelled at some point between seventh and twelfth grade, African-American students and students with disabilities were disproportionately likely to experience disciplinary removal from the classroom, students who were suspended or expelled were more likely to be held back or drop out, and were more likely to be involved with the juvenile justice system one year later. A 2014 follow-up report, The School Discipline Consensus Report, provided over 60 recommendations from improving school discipline.
Locally, rates of disciplinary removals have decreased in recent years, although rates differ across school districts. Additionally, Black students continue to be over-represented in the school discipline population, when compared to their representation in the overall student population, in many districts.
Students identifying as Black or African-American were over-represented in the population of students subject to school discipline across local districts, a trend in line with those reported in the Breaking Schools’ Rules report . Although the figures below do not account for other factors that may influence school discipline, the Breaking Schools Rules research team conducted a multivariate analysis which controlled for other factors and found that African-American students were subject to school discipline at higher rates than other racial and ethnic groups, even when controlling for factors like income. This disparity is particularly prevalent for African-American males. In Austin ISD, Black students made up 16% of students receiving In-School Suspensions, but only 8% of the overall student population. In Del Valle ISD, Black students made up 14% of students receiving In-School Suspensions, but only 9% of the overall student population. In Manor ISD, Black students made up 28% of students receiving In-School Suspensions, but only 20% of the overall student population. In Pflugerville ISD, Black students made up 28% of students receiving In-School Suspensions, but only 16% of the overall student population. In Leander ISD, Black students made up 9% of students receiving In-School Suspensions, but only 4% of the overall student population.
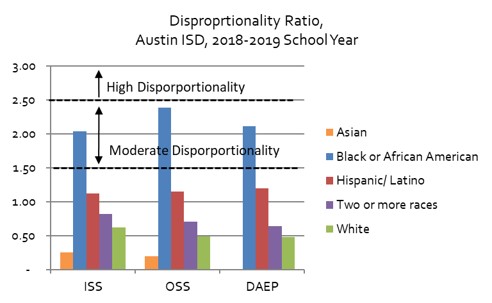
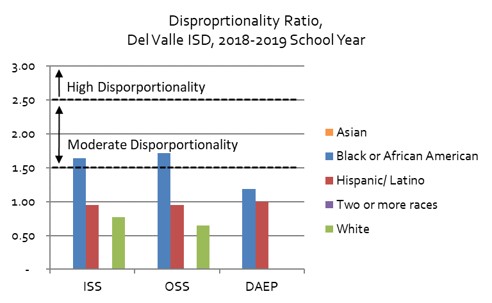
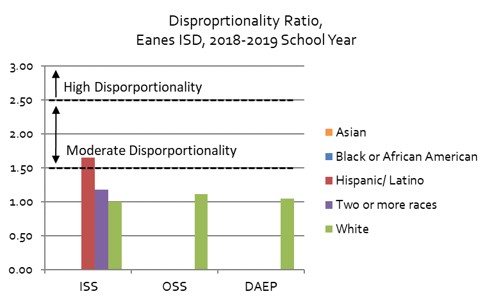

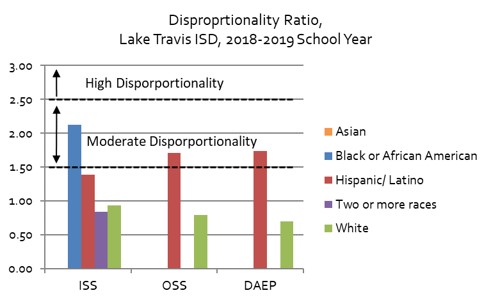
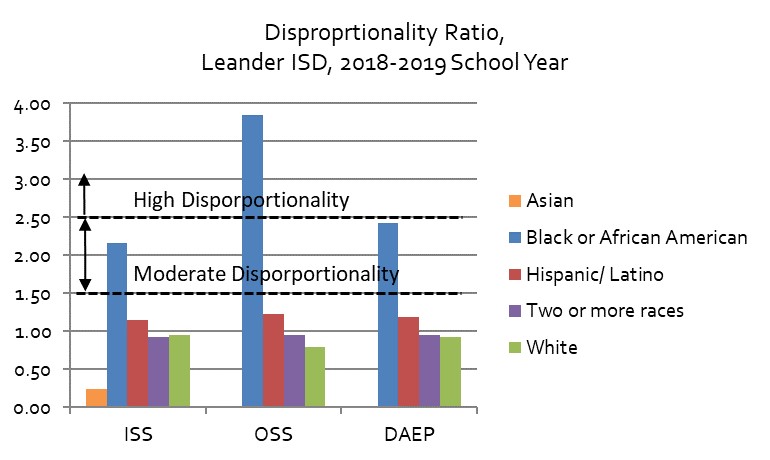
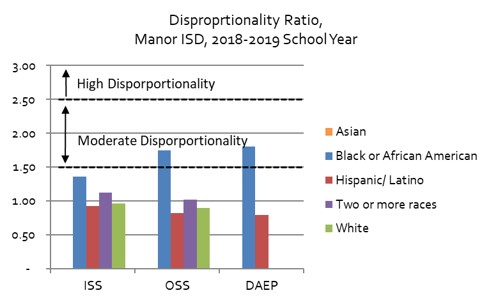
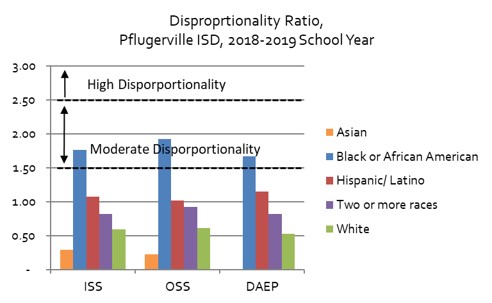
Definition: The disproportionality ratio represents the share of students subject to a given disciplinary action who identify as a given race or ethnicity divided by the share of students of that race or ethnicity in the overall student population in a district. Disproportionality ratios are classified as follows: Comparable Representation (rates under 1.50), Moderate Disproportion (rates between 1.50-2.49), High Disproportion (rates between 2.50-3.49), and Extreme Disproportion (rates of 3.50 and over).
Data Source: Texas Education Agency, Discipline Data. The disproportionality ratio classification system was developed by the Center for the Study of Social Policy.
Data Considerations: The numerator represents the districts total discipline population in a given school year. This represents the number of students subject to disciplinary action, rather than the number of actions. A students may be subject to more than one disciplinary action in a given school year. Total students (and total by race) represents Cumulative Year-End Enrollment and may differ from other estimates of the total student populations, including among other Texas Education Agency reports, such as the Texas Academic Performance Reports (TAPR measures enrollment on a given day in October of each year). To protect confidentiality, TEA does not report aggregate data when the number of students subject to a disciplinary action is less than 5 (but greater than zero). Therefore, missing data may indicate no students or up to five students of a given race or ethnicity were subject to a disciplinary action.
Local school districts have largely made progress in reducing the percentage of students subject to each type of disciplinary action. In-School Suspension appears to be the most commonly used type of disciplinary measure across districts, though Austin ISD has similar rates of in-school and out-of-school suspensions. Schools in western and central Travis County tended to have lower rates of in-school suspensions than schools in eastern Travis County.
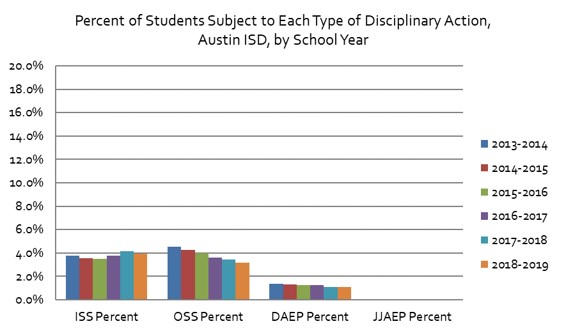
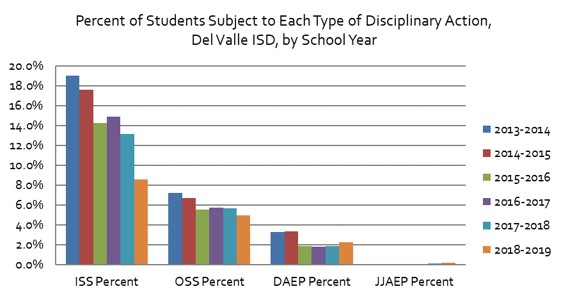

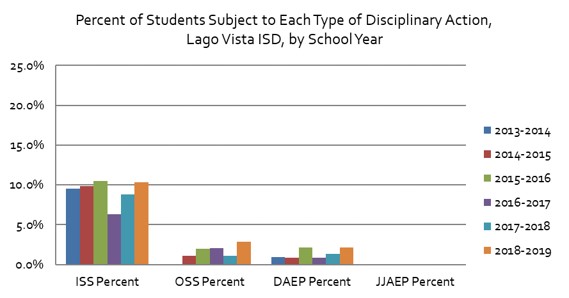

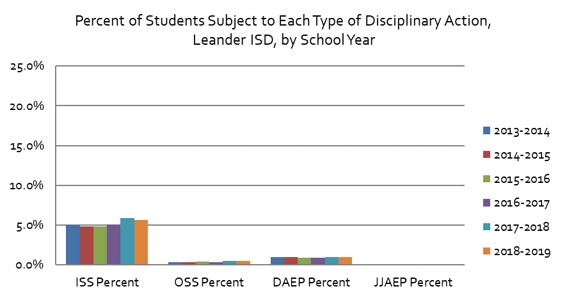

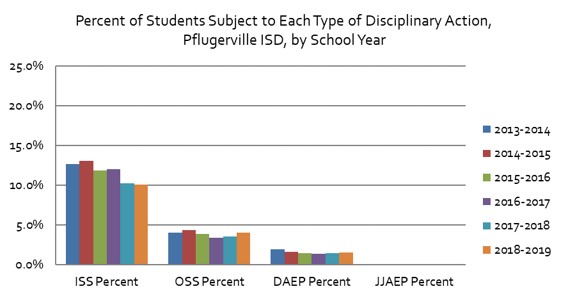
Definition: The percentage of students subject to a given type of disciplinary action that resulted in removal from the classroom. Discipline actions shown include In-School Suspension, Out-of-School Suspension, placement in a Disciplinary Alternative Education Program, and Placement in a Juvenile Justice Alternative Education Program.
Data Source: Texas Education Agency, Discipline Data
Data Considerations: The numerator of each percent represents the number of students subject to a given type of disciplinary action in a school year, rather than the number of actions. A students may be subject to more than one disciplinary action in a given school year. Also, student counts are unduplicated in each disciplinary category, but a given student may be subject to more than one type of disciplinary action in a given school year. Total students (and total by race) represents Cumulative Year-End Enrollment and may differ from other estimates of the total student populations, including among other Texas Education Agency reports, such as the Texas Academic Performance Reports (TAPR measures enrollment on a given day in October of each year)
Across local districts, boys are placed into Disciplinary Alternative Education Programs at higher rates than girls. During the 2013-2014 school year, 1.97% of boys in Austin ISD were placed into DAEP, compared to 0.74% of girls. In Del Valle ISD, 4.77% of boys were placed into DAEP, compared to 1.67% of girls. In Manor ISD, 3.12% of boys were placed into DAEP, compared to 1.21% of girls. In Pflugerville ISD, 2.71% of boys were placed into DAEP, compared to 1.17% of girls.


Definition: The percentage of students placed in Disciplinary Alternative Education Programs in each school year, by sex
Data Source: Texas Education Agency, Discipline Data
Data Considerations: The numerator of each percent represents the number of students subject to a given type of disciplinary action in a school year, rather than the number of actions. A students may be subject to more than one disciplinary action in a given school year. Total students (and total by race) represents Cumulative Year-End Enrollment and may differ from other estimates of the total student populations, including among other Texas Education Agency reports, such as the Texas Academic Performance Reports (TAPR measures enrollment on a given day in October of each year)
Disciplinary Action Resulting in Classroom Removal
Overall, districts in the state of Texas have reduced the rate at which students are removed from their classroom to a Disciplinary Alternative Education Program. Local trends vary by school district, with districts in eastern Travis County utilizing these programs to a greater extent than districts in other parts of the county. Notably, Austin ISD saw a significant reduction in the number of students sent to a DAEP between the 2011-2012 and 2013-2014 school years. School leaders credit this to a change in the approach to discretionary removals.

Definition: Disciplinary actions that resulted in a removal to a Disciplinary Alternative Education Program as a percentage of cumulative student enrollment. Students may be subject to more than one action. Therefore, some students may be counted more than once in the numerator. The figure is expressed as a percentage of student enrollment to allow comparison across districts of different sizes.
Data Source: Texas Education Agency, Discipline Data
Data Considerations: The numerator of each percent represents the number of students subject to a given type of disciplinary action in a school year, rather than the number of actions. A students may be subject to more than one disciplinary action in a given school year. Total students (and total by race) represents Cumulative Year-End Enrollment and may differ from other estimates of the total student populations, including among other Texas Education Agency reports, such as the Texas Academic Performance Reports (TAPR measures enrollment on a given day in October of each year)
2018 © Ready by 21 Austin
Ready by 21 (RB21) and the RB21 logo are registered trademarks of the Forum for Youth Investment. The Central Texas RB21 Coalition is a member of the Forum’s RB21 Learning Network. The Central Texas RB21 online dashboard is currently sponsored by Workforce Solutions — Capital Area Workforce Board, the Community Advancement Network (CAN) and the City of Austin, with content and data contributions from over 20 local youth-serving coalitions.